
Why price history transforms online shopping in 2026
Online product prices can swing by 20 to 30% throughout the year, yet most shoppers buy without checking whether they’re paying peak rates. This price volatility means you could overpay simply by clicking purchase at the wrong time. Price history data reveals hidden patterns in retailer pricing strategies, helping you identify genuine discounts and avoid inflated sale prices. Understanding when prices typically drop puts you in control, turning guesswork into informed buying decisions that maximize your savings.
Table of Contents
- Why Price History Matters For Online Shoppers
- How Retailers Use Dynamic And Psychological Pricing Strategies
- Common Pricing Patterns And Seasonal Trends To Watch
- What Most People Get Wrong: Misconceptions About Price Drops And Sales
- How Price History Helps You Save: Practical Applications And Tools
- Limitations And Considerations When Using Price History
- Summary: Leveraging Price History For Smarter Shopping Decisions
- Discover How PriceLix Makes Price History Work For You
- Frequently Asked Questions About Price History And Online Shopping
Key takeaways
| Point | Details |
|---|---|
| Price history reveals retailer tactics | Exposes dynamic pricing and psychological tricks retailers use to influence purchases. |
| Best deals occur off-season | Over 40% of genuine discounts happen outside major holiday sales periods. |
| Sales misconceptions cost money | Many advertised sales inflate prices beforehand, making history essential for verification. |
| Automation amplifies savings | Tools like PriceLix simplify tracking across stores and alert you to real price drops. |
| Combining data improves timing | Merging price history with real-time alerts and market context optimizes purchase decisions. |
Why price history matters for online shoppers
Prices for identical products shift constantly across retailers and even within the same store over days or weeks. Without visibility into these fluctuations, you risk buying during peak pricing windows and missing opportunities to save. Price history reveals how much a product’s price has changed over weeks, months, or years, giving you the context to evaluate whether today’s price represents a good deal.
Understanding these trends transforms your shopping approach. Instead of impulse purchases based on marketing claims, you make calculated decisions grounded in data. Most shoppers currently lack this insight and pay the premium for that gap. Price history closes it.
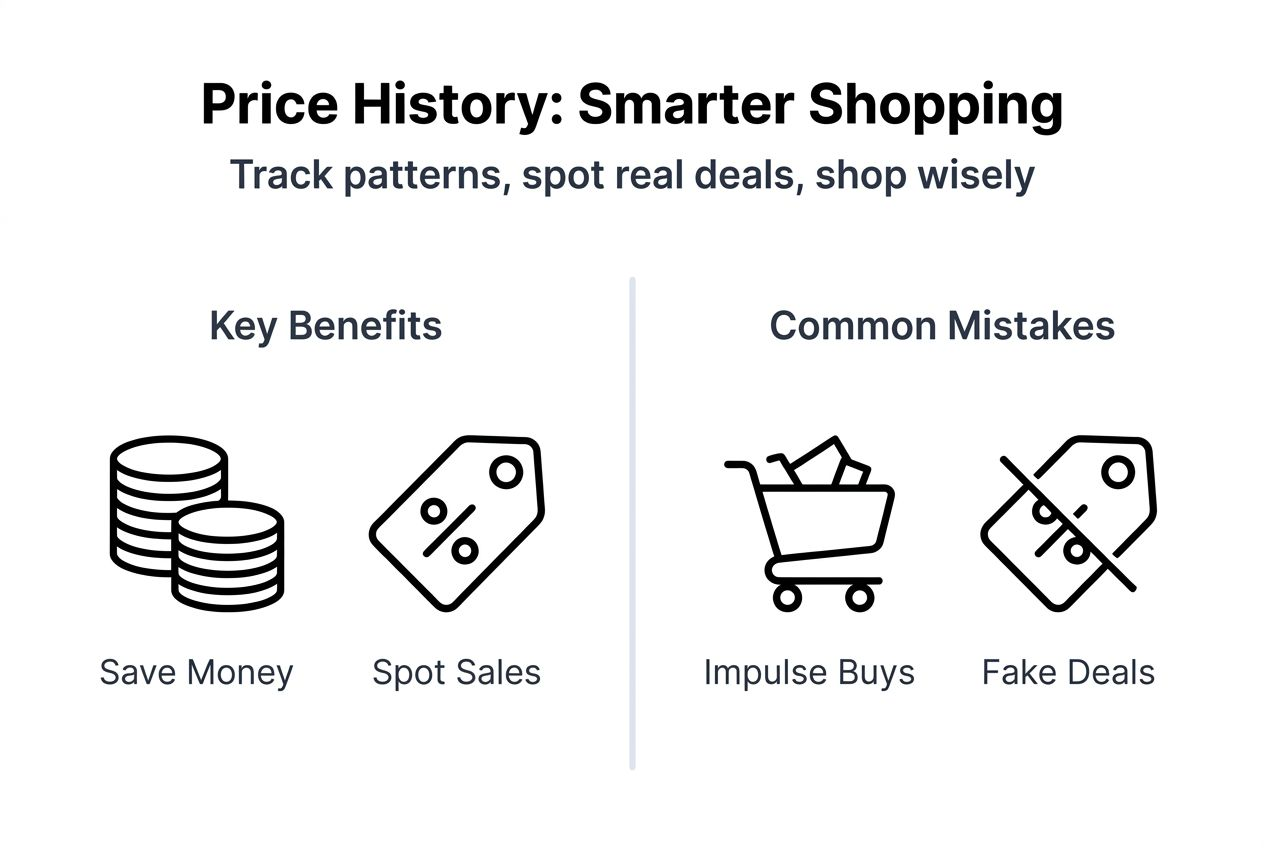
Consider these core benefits:
- Identify optimal buying windows when prices historically dip
- Recognize artificially inflated sale prices before major promotional events
- Avoid paying peak rates by understanding seasonal and weekly patterns
- Build confidence in purchase timing through evidence-based analysis
- Reduce buyer’s remorse by knowing you secured a fair price
Price history isn’t just numbers on a chart. It’s your roadmap to smarter spending, revealing when retailers expect you to buy and when they genuinely need to move inventory.
How retailers use dynamic and psychological pricing strategies
Retailers employ sophisticated algorithms to adjust prices based on demand, competitor rates, inventory levels, and even your browsing behavior. Dynamic pricing means the cost you see today could increase tomorrow if demand spikes or decrease if inventory needs clearing. Without monitoring price history, you remain blind to these fluctuations and vulnerable to paying inflated rates.

Psychological pricing tactics add another layer. Retailers price items at $19.99 instead of $20 to create a perception of greater value, even though the difference is minimal. They anchor high original prices next to sale prices to make discounts appear larger than they are. Price history data cuts through this manipulation by showing actual pricing trends over time, not just the snapshot retailers want you to see.
Recognizing these strategies helps you shop defensively:
- Dynamic pricing adjusts multiple times daily on high-demand products
- Artificial price anchoring exaggerates discount percentages during sales
- Flash sales create urgency but often revert to similar prices later
- Personalized pricing may show different costs based on your location or device
- Pre-sale price increases make subsequent discounts less impressive
Pro Tip: Check price history for at least 30 days before major sales events. Retailers frequently raise prices two to three weeks before Black Friday or Prime Day, then advertise those temporary inflations as baselines for calculating sale discounts.
Tools that automatically track and analyze price history expose these nuances without requiring you to manually monitor dozens of products across multiple stores. They give you the upper hand in a pricing game designed to maximize retailer profit.
Common pricing patterns and seasonal trends to watch
Certain product categories follow predictable pricing cycles tied to seasons, product launches, and retail calendars. Electronics typically experience price drops of 10 to 12% from Q4 to Q1 as retailers clear holiday inventory and manufacturers release updated models. Apparel follows opposite patterns, with summer clothing hitting lows in late August and winter gear discounting heavily in February.
Many retailers also implement mid-cycle and weekly discounts outside traditional sales periods. Tuesday and Wednesday often see lower prices on select categories as stores test pricing elasticity or respond to competitor moves. Price history charts visualize these cycles, helping you anticipate when specific products will likely reach their lowest points. Knowing these patterns prevents buying at peak prices simply because you need something immediately.
Watch for these recurring trends:
- Consumer electronics drop sharply in January and February post-holiday
- Outdoor furniture and grills discount heavily in September and October
- Fitness equipment sees best prices in January after New Year demand surge
- Back-to-school items discount in late August and early September
- Holiday decorations plummet 50 to 70% immediately after each holiday
| Product Category | Best Buying Months | Typical Discount Range |
|---|---|---|
| Electronics | January, February | 10 to 25% |
| Apparel | End of season | 30 to 50% |
| Home & Garden | September, October | 20 to 40% |
| Fitness Equipment | February, March | 15 to 30% |
| Toys | January, February | 25 to 50% |
Identifying and tracking these patterns through price comparison tools gives you a strategic advantage. You stop reacting to retailer marketing and start planning purchases around actual pricing data.
What most people get wrong: misconceptions about price drops and sales
Many shoppers assume advertised sales represent genuine discounts, but 65% of shoppers mistakenly believe all price drops during sales are legitimate savings. Price history reveals a different reality. Retailers often inflate prices weeks before major sales events, then discount back to normal or slightly below average prices while advertising significant percentage savings.
Over 40% of genuine discounts occur outside major sales periods like Black Friday, Prime Day, or holiday weekends. You might find better prices on random Tuesday afternoons than during heavily marketed sales extravaganzas. This misconception leads shoppers to cluster purchases around specific dates, often paying more than necessary or missing superior deals that happen quietly throughout the year.
Relying solely on sales announcements without checking price history creates several risks:
- Missing better prices that occurred weeks earlier or will appear soon after
- Falling for inflated baseline prices that make discounts look larger
- Ignoring mid-cycle clearances that offer deeper actual savings
- Creating urgency around artificial scarcity during flash sales
- Overlooking price matching opportunities from competitors
“The biggest mistake shoppers make is trusting sale labels without verifying actual price history. What looks like a 40% discount might only represent a 10% reduction from the product’s typical selling price over the past three months.”
External research on consumer misconceptions confirms these patterns persist across categories and retailers. Price history serves as your fact-checker, separating marketing claims from mathematical reality.
How price history helps you save: practical applications and tools
Case studies demonstrate that shoppers who actively use price history data save 15% or more compared to those who buy reactively. Automated tools increase those savings by an additional 12 to 18% by catching price drops you might miss manually. The key is moving from passive shopping to strategic purchasing based on evidence.
Follow this step-by-step approach to leverage price history effectively:
- Identify products you plan to purchase within the next 30 to 90 days
- Begin tracking prices across multiple retailers using automated tools
- Review 60 to 90 days of historical data to identify typical price ranges
- Set alerts for prices 10 to 15% below current levels based on history
- Combine price data with seasonal trends and market conditions
- Purchase when alerts trigger and prices reach identified low points
- Continue monitoring after purchase to refine future buying strategies
PriceLix streamlines this entire process without requiring browser extensions or manual price checks. It tracks items across Amazon, eBay, Walmart, and over 1,000 other stores automatically, sending alerts when prices hit your target thresholds. The platform’s dashboard consolidates all your tracked products in one place, making it easy to track online prices and act on opportunities quickly.
Pro Tip: Start tracking high-value items like electronics, appliances, and furniture at least 60 days before you need them. This window gives you enough data to recognize patterns and catch periodic discounts that might save you hundreds of dollars on single purchases.
Using alerts reduces the risk of missing fleeting discounts that last only hours or days. It also cuts the manual effort of checking prices daily, freeing your time while ensuring you never overpay. Explore comprehensive guides like the price tracking checklist for 2026 and learn about different types of price tracking to refine your approach.
Limitations and considerations when using price history
Price history provides valuable context, but it’s not a crystal ball. Prediction accuracy based solely on historical data hovers around 75%, meaning unexpected factors can disrupt established patterns. Supply chain disruptions, sudden demand spikes, manufacturer issues, or market-wide economic shifts can cause prices to move contrary to historical trends.
Relying exclusively on price history without considering real-time market conditions can lead to mistimed purchases. A product that historically drops in January might stay elevated this year if production delays limit inventory. Similarly, viral social media trends can spike demand unpredictably, driving prices up regardless of seasonal norms.
Keep these limitations in mind:
- Past pricing patterns don’t guarantee future repetition
- External events like pandemics or natural disasters disrupt normal cycles
- New product launches alter pricing dynamics for older models
- Retailer strategy changes can break historical patterns
- Limited historical data for new products reduces prediction reliability
The solution is combining price history with real-time alerts, inventory monitoring, and broader market awareness. Use history as one input in your decision-making process, not the sole determinant. When price history signals a good buying window and real-time data confirms low current prices, you maximize confidence in your purchase timing.
Setting realistic expectations prevents frustration. You won’t catch every absolute bottom price, but you will consistently avoid peak pricing and secure above-average deals. That consistent performance compounds into substantial savings over time.
Summary: leveraging price history for smarter shopping decisions
Price history uncovers hidden savings opportunities by exposing when retailers typically discount products and when they inflate prices. This visibility transforms you from a reactive shopper responding to marketing into a strategic buyer making data-informed decisions. Awareness of dynamic pricing, psychological tactics, and seasonal patterns empowers you to time purchases for maximum value.
Automated tools dramatically simplify the tracking process and increase your savings potential. Instead of manually monitoring dozens of products across multiple sites, platforms like PriceLix handle the heavy lifting while you focus on making smart buying choices when alerts signal opportunities.
Key principles to remember:
- Price history reveals true value by showing long-term pricing trends
- Over 40% of best deals occur outside major advertised sales events
- Combining historical data with real-time alerts optimizes purchase timing
- Automated tracking saves time and catches price drops you might miss
- Understanding retailer strategies helps you avoid psychological pricing traps
Starting to use price history is a practical step toward reducing what you pay for everything you buy online in 2026 and beyond. The data is available, the tools are accessible, and the savings potential is substantial. The question isn’t whether price history works, but whether you’re ready to use it.
Discover how PriceLix makes price history work for you
Ready to stop overpaying and start saving on every online purchase? PriceLix offers automated price tracking across more than 1,000 stores including Amazon, eBay, and Walmart without requiring browser extensions or manual effort. Our platform continuously monitors price history for items you care about and alerts you instantly when prices drop to your target levels.
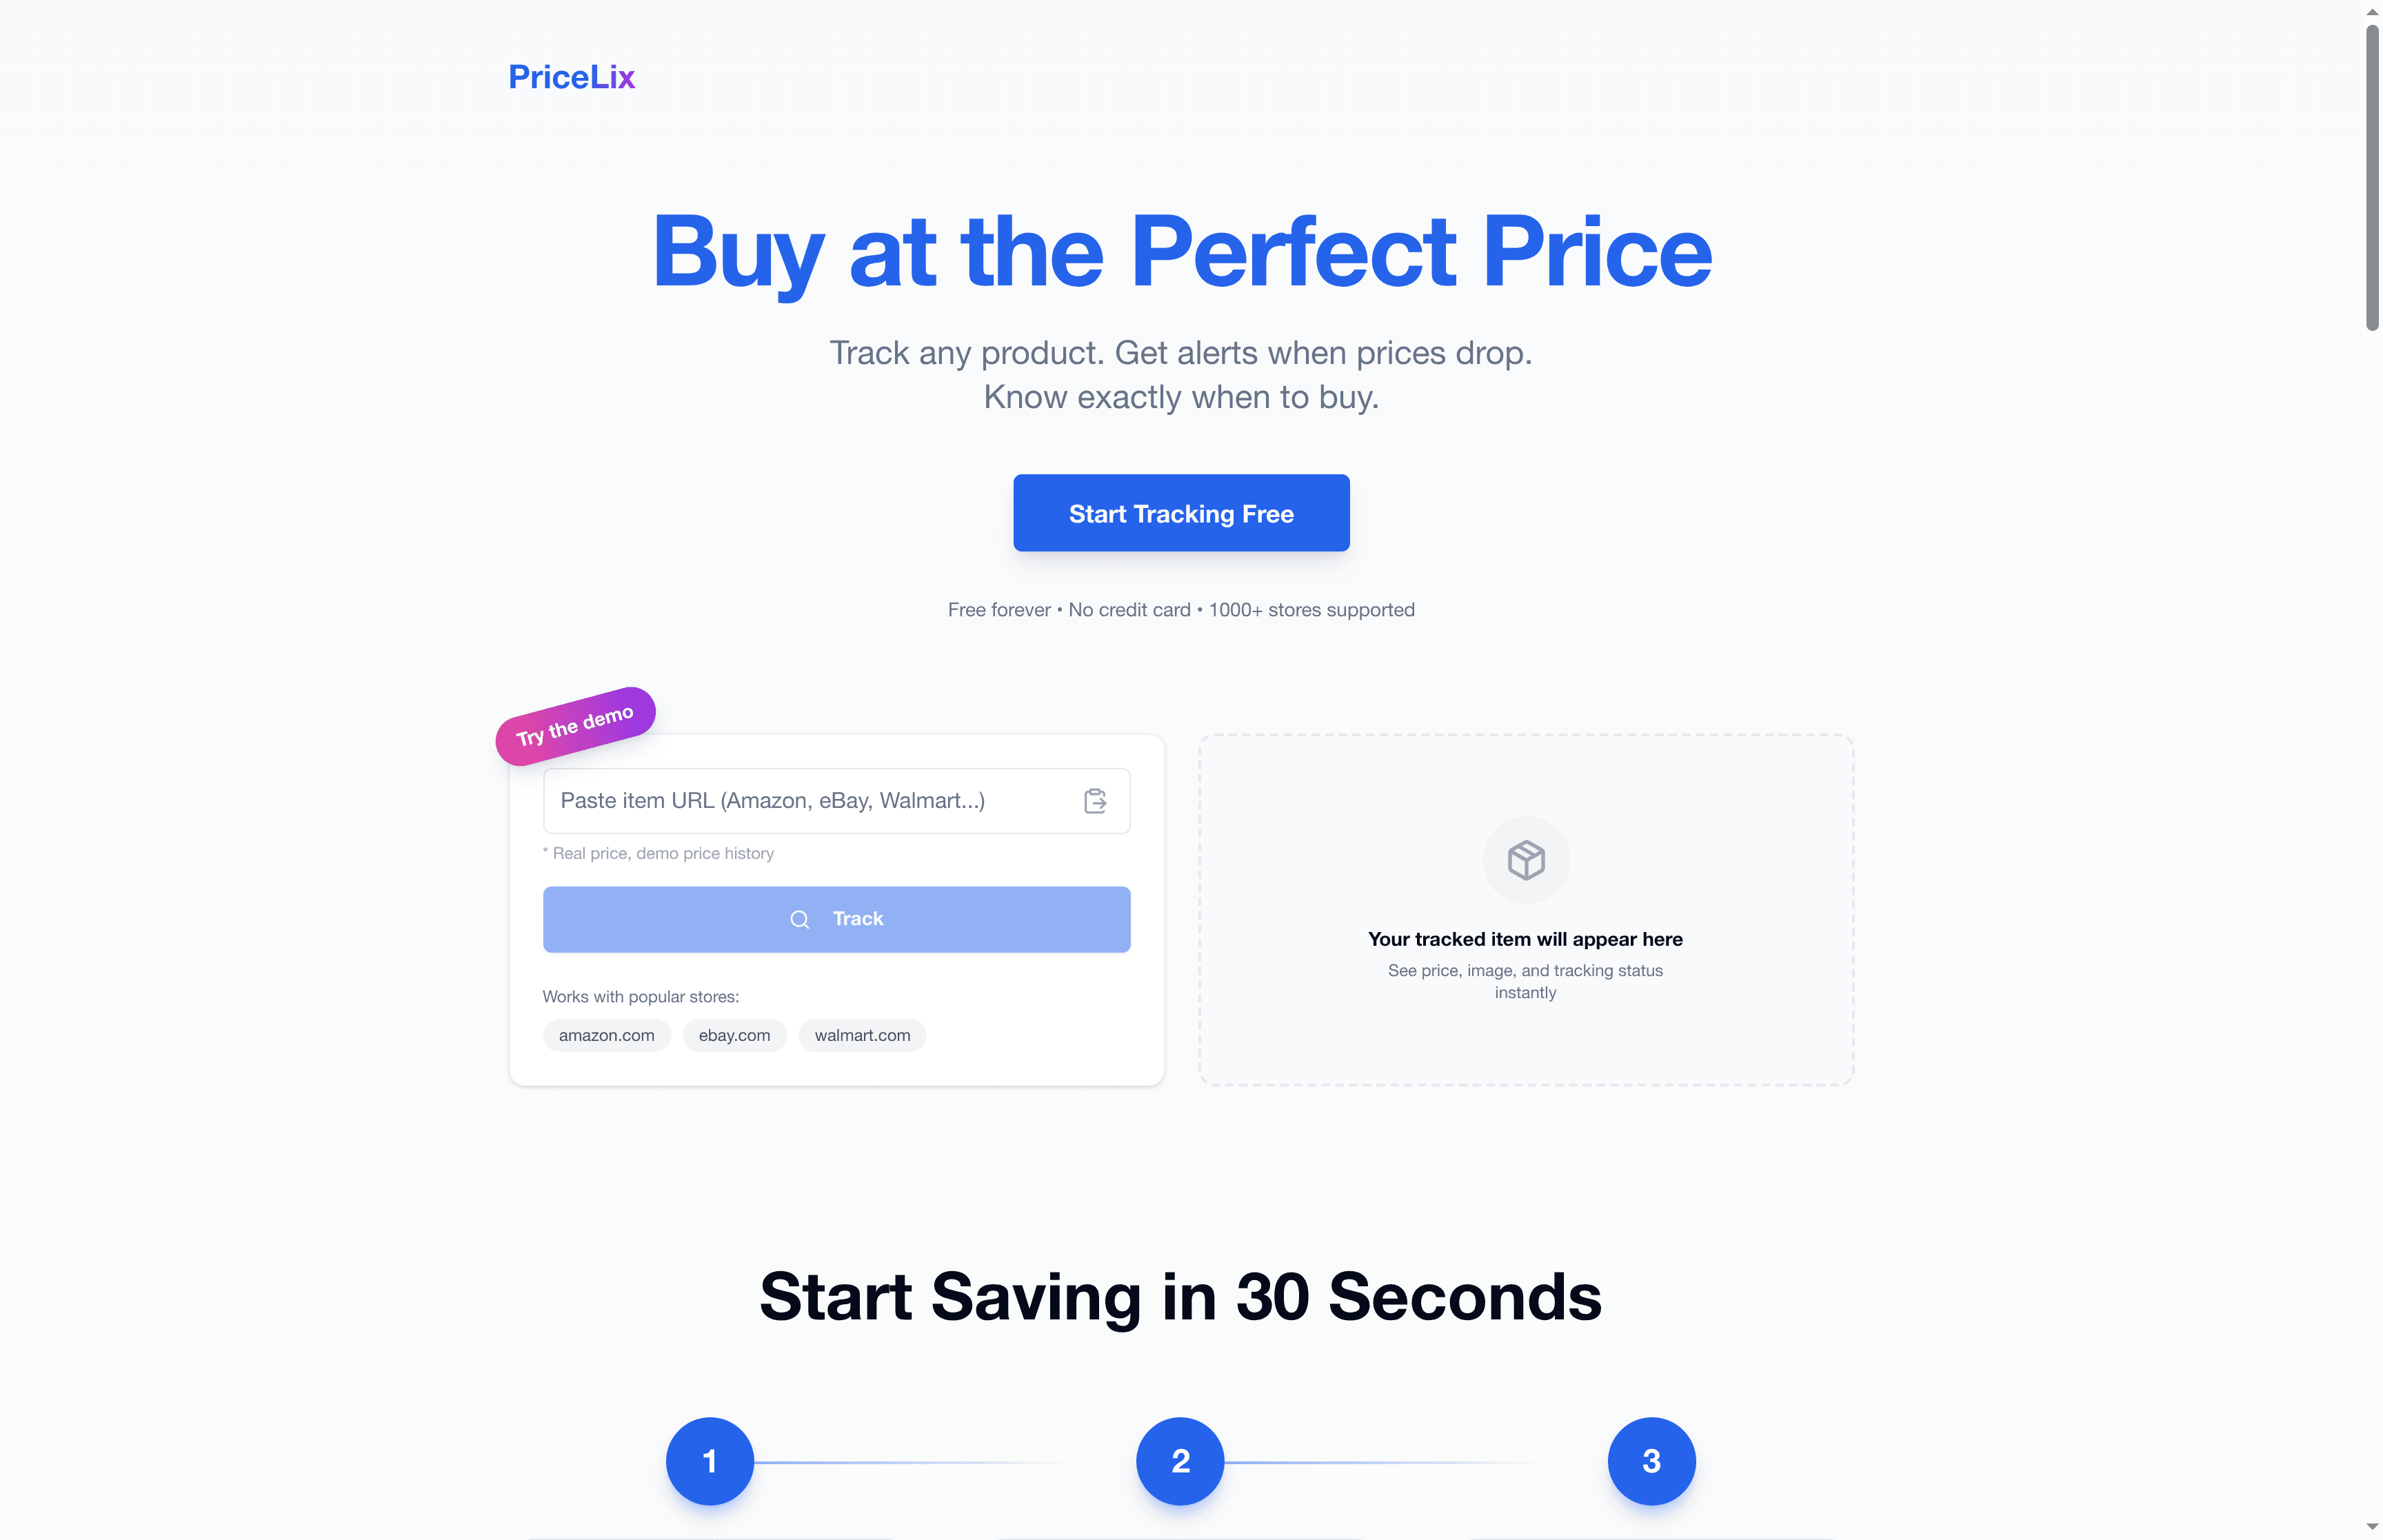
PriceLix simplifies everything covered in this guide into a single dashboard where you track products, review historical trends, and receive notifications when it’s time to buy. You’ll save time compared to manual monitoring while increasing your actual savings by capitalizing on price drops you would otherwise miss. Start leveraging price history data effortlessly and take control of your online shopping budget with PriceLix today.
Frequently asked questions about price history and online shopping
How far back should I check price history before buying?
Review at least 60 to 90 days of price history to identify meaningful patterns and typical price ranges. For seasonal items, checking a full year reveals annual cycles and helps predict when prices will drop. Newer products may have limited history, so focus on available data and supplement with category trends.
Can price history predict exactly when prices will drop?
Price history identifies likely timing windows based on past patterns but cannot guarantee exact future prices. Accuracy improves when historical trends are consistent and external factors remain stable. Combine history with real-time alerts to catch actual drops when they occur rather than relying solely on predictions.
Do all retailers follow similar pricing patterns?
Pricing patterns vary by retailer, product category, and market position. Large retailers like Amazon adjust prices more frequently than smaller specialty stores. Category-specific trends exist, such as electronics dropping post-holiday, but individual retailer strategies differ. Track your specific products across preferred retailers for personalized insights.
Is price history useful for everyday items or just big purchases?
Price history benefits both categories differently. For high-value items, it can save hundreds of dollars per purchase. For everyday consumables, tracking reveals bulk buying opportunities and recurring discount cycles that reduce costs over time. The percentage saved may be smaller per item, but volume purchases amplify total savings.
How do automated tools improve on manual price checking?
Automated tools monitor prices continuously, catching short-lived drops that manual checking easily misses. They track unlimited products simultaneously across multiple stores without your active involvement. Alerts notify you instantly when target prices hit, eliminating the need to remember and check dozens of items daily. This consistency and coverage increase your savings by 12 to 18% compared to manual methods.
What happens if price history shows steady increases instead of drops?
Steady price increases may indicate rising demand, supply constraints, or product discontinuation. In these cases, buying sooner rather than waiting prevents paying even higher prices later. Price history helps you recognize these upward trends early, allowing you to decide whether to purchase now or seek alternative products with more favorable pricing patterns.